
Precision agriculture
for crops.
Detects gaps along sugarcane rows and generates an actionable replanting map, optimizing cost and yield per field.
An actionable
replanting map.
Ranger Vision delivers four key advantages over traditional field scouting and manual image review.
Better detection
A higher detection rate and accuracy through smart models. Maximizes final yield per hectare.
Season-over-season comparability
Comparable data across seasons to assess performance, spot patterns and adjust practices with technical backing.
Shorter replanting windows
Cuts replanting lead times so you can act fast and maximize yield, with fewer delays and quicker decisions in the field.
Lower operating costs
Reduces spend on ground patrols and manual image review by analysts.
How does
the process work?
From orthomosaic upload to field execution, in five auditable steps. Each stage produces a deliverable ready to plug into your systems.
Create inspection
Upload the orthomosaic (OM) or flight photos for processing. Link it to the field and season.
Field delineation
Generate polygons to clip the OM, the row model, and inclusion and exclusion polygons.
Detection & analysis
Proprietary models that detect the different actionable layers: gaps and rows without vegetation, rocks, weeds and more.
Visualization
Managed from the portal. Dashboard with layer control and KPIs for coverage, gaps and seed boxes.
Field execution
Export planter-compatible files (.shp, .kml, .tiff) to carry out the replanting work.
What your
team takes away.
A complete set of layers and reports designed to plug into your season operation.
Gap map.
Plant count per unit.
Seed-box calculation per area.
Interactive map with every layer and field data.
Geo PDF to review the field from mobile devices.
Results report delivered by email.
File downloads for planter integration.
Download of all material used and generated during the season.
Season analytics and management from the portal.
Rock detection to protect resowing machinery.
Broadleaf weed detection.
Every field,
actionable layers.
A set of exportable layers that prioritize what to replant, how much to buy and where to focus the operation. Each has its own filters and downloads in KML / SHP / GeoJSON. The catalog grows season after season.
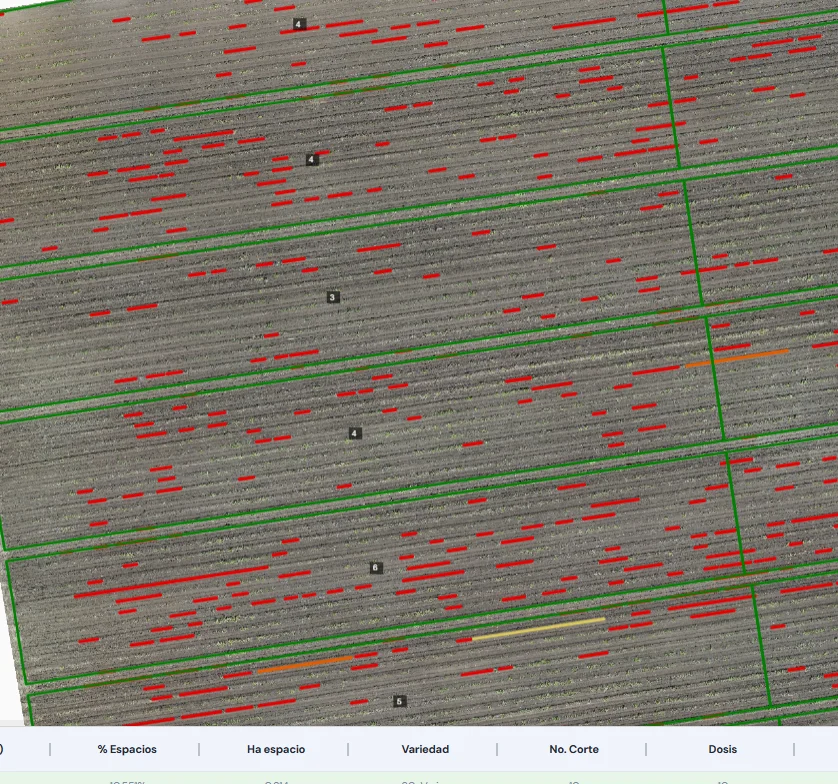
Replanting seed boxes
Field zoning with automatic input calculation. Each area gets a georeferenced estimate of the seed boxes required based on the extent of the detected gaps.
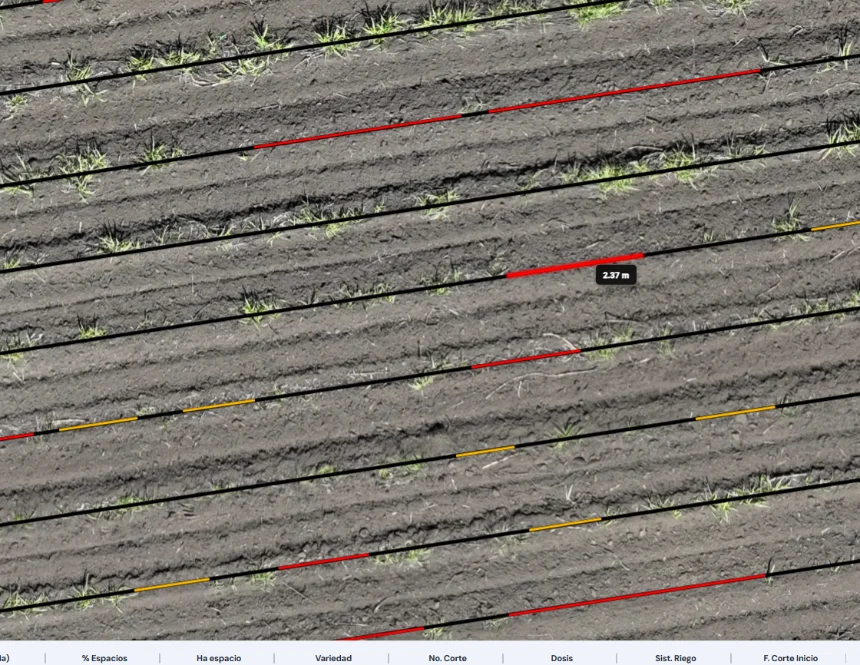
Replanting gaps
Gaps detected above a configurable replanting threshold. Exportable layer with filtering by size range or by % of gaps per row to prioritize the highest-impact areas.
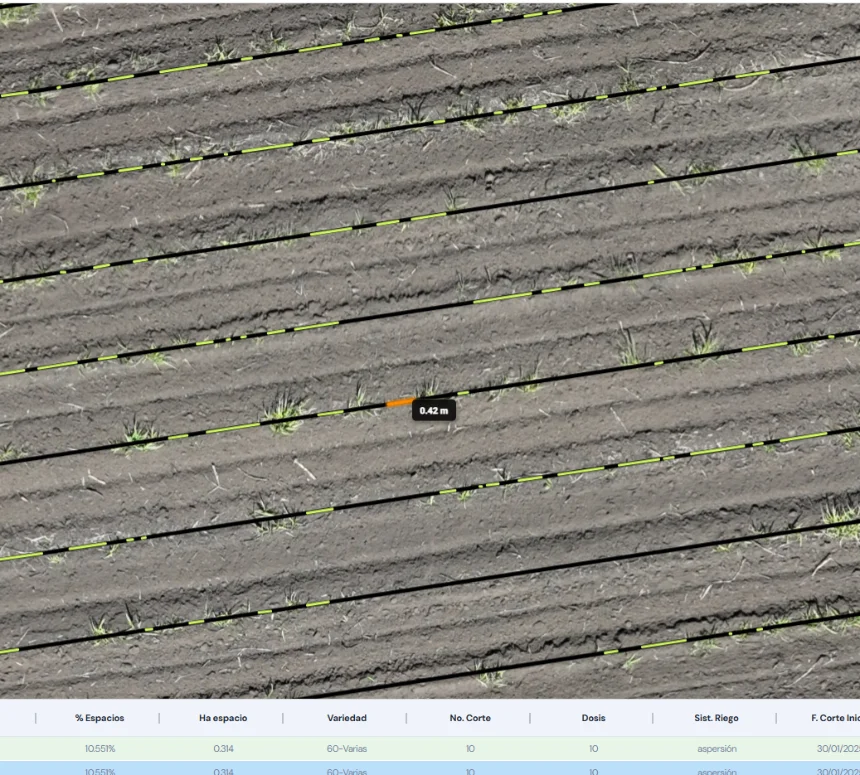
Planting quality
A record of gaps below the replanting threshold. Exportable layer with selectable metric ranges for a fine-grained diagnosis of stand establishment.
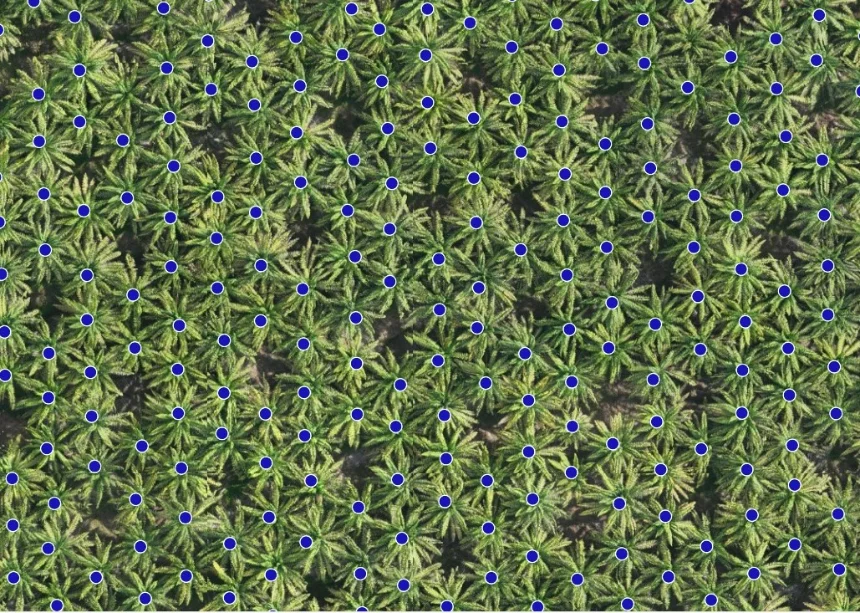
Plant counting
Individual detection and counting of plants in perennial and tree crops — palm, citrus, fruit — with georeferenced positions for inventory, replacement and per-unit tracking.
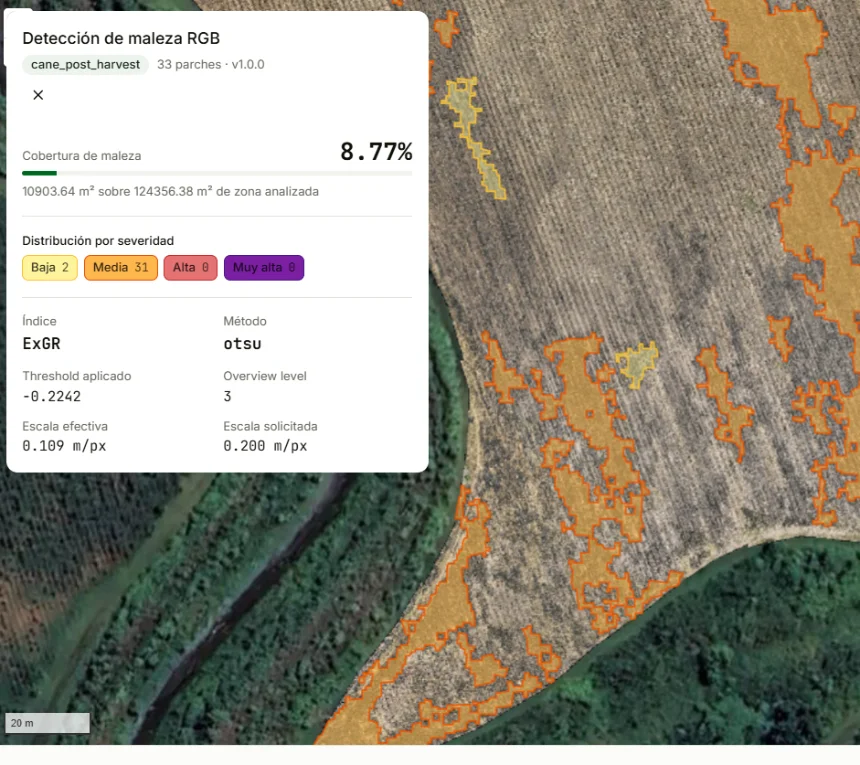
Weed detection
Georeferenced polygons of areas with weed presence to guide application decisions, target spraying and cut field-scouting costs.
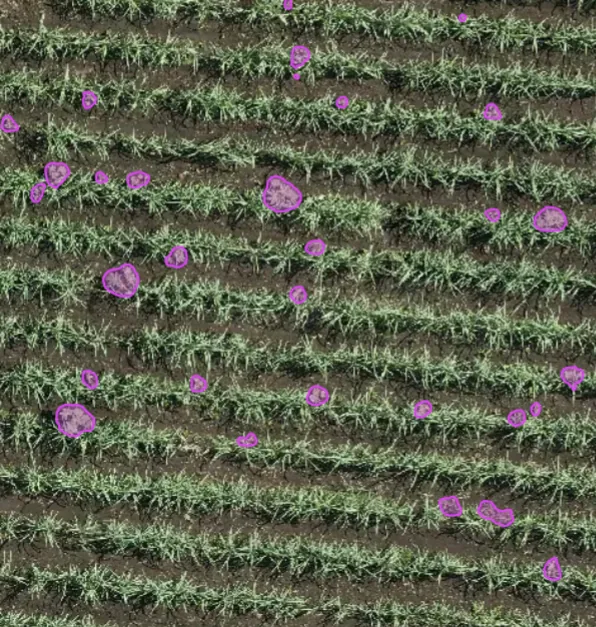
Broadleaf weed detection
Georeferenced polygons of broadleaf weeds to guide application decisions, target spraying and cut field-scouting costs.
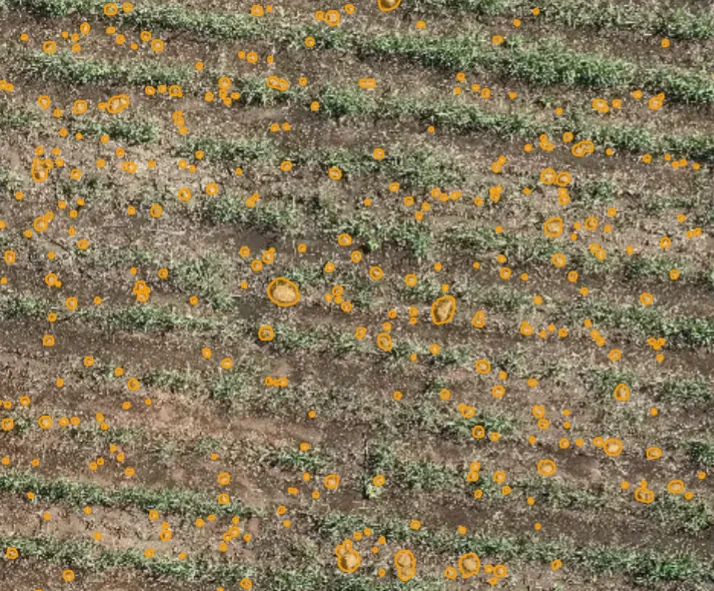
Rock detection
Georeferenced polygons of rocks in the field to protect resowing machinery and plan stone removal before the operation.
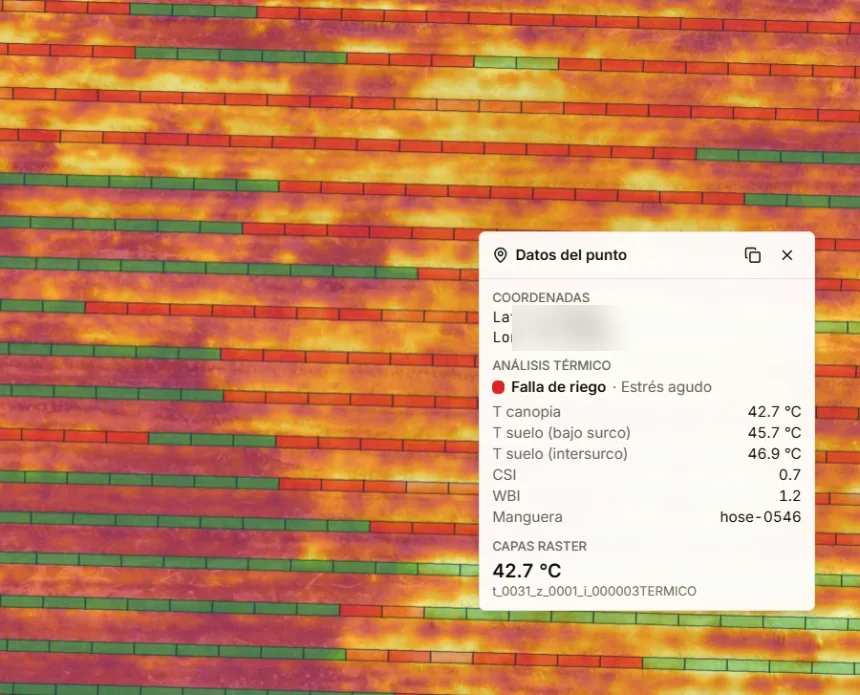
Irrigation quality
Analysis over a thermal orthomosaic cross-referenced with RGB detection. Identifies possible leaks, clogging, over-irrigation or ponding, separating crop failures from irrigation failures.
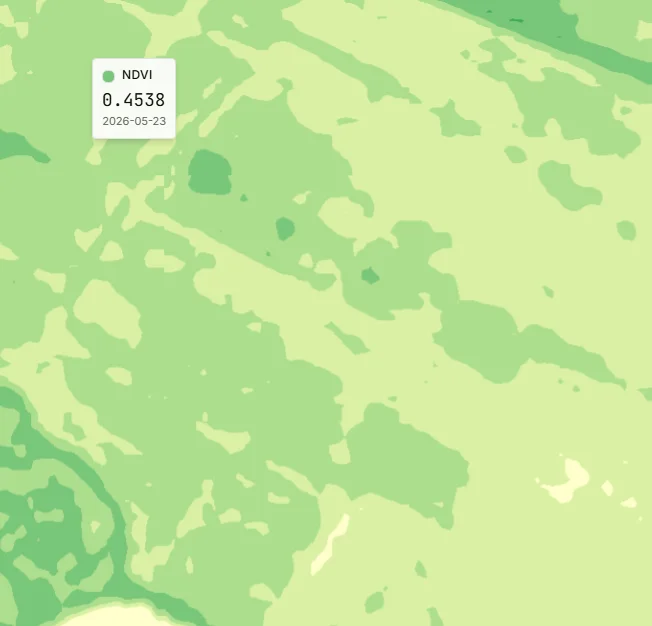
Satellite imagery
Moisture, vegetation and remote crop-monitoring data from satellite imagery. Complements flights with continuous coverage between seasons.
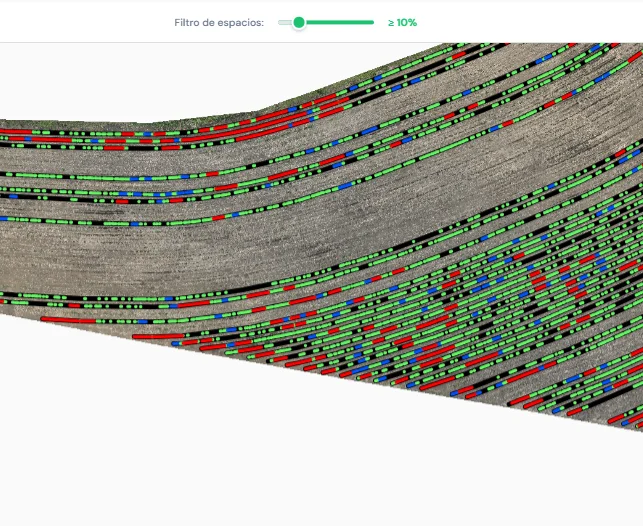
Row filter by % of gaps
Exportable layer with configurable filtering by percentage of gaps per row. Focuses the replanting operation on the highest-impact rows.
Geo PDF
The complete georeferenced field report, to open on your phone in the field. Locate yourself in real time over the detected layers.

 Query your fields with AIDigital agronomistGenerates smart reports on the analysis results, adding weather and satellite data. Query everything in natural language from WhatsApp or Telegram.Discover Scuadra →
Detection models based on vegetation indices and thresholding, plus row replication by progressive interpolation. Every inspection is validated by a Ranger specialist before delivery.
We are working
on what comes next.
New features in development to keep improving our users’ experience and broaden the product’s coverage.
Multispectral map
Yield estimation
Not seeing your challenge on this list? We’ll solve it with you.
Ranger Vision adapts to your operation, not the other way around. If your crop, your field or your process needs a different analysis, we build the layer, model or integration required, adapting to the way you work.
Service
options.
You pay only for the hectares actually analyzed. Custom quote based on volume, format and the needs of each operation, with no annual licenses or per-season minimums.
- Specialist verification by Ranger — every inspection is validated by a human before delivery.
- First-year storage included, at no additional cost.
- Results and layers (.GeoJSON / .KML / .SHP) at no cost for the full term.
Start your free trial.
Upload your orthomosaic (or photos to generate it) of up to 20 hectares and get results in under 48 hours. We coordinate the processing details by email.